Reefer Freight Rates: Historical Average, How to Benchmark, Most Expensive Lanes, How Are They Calculated
Blog Post CTA
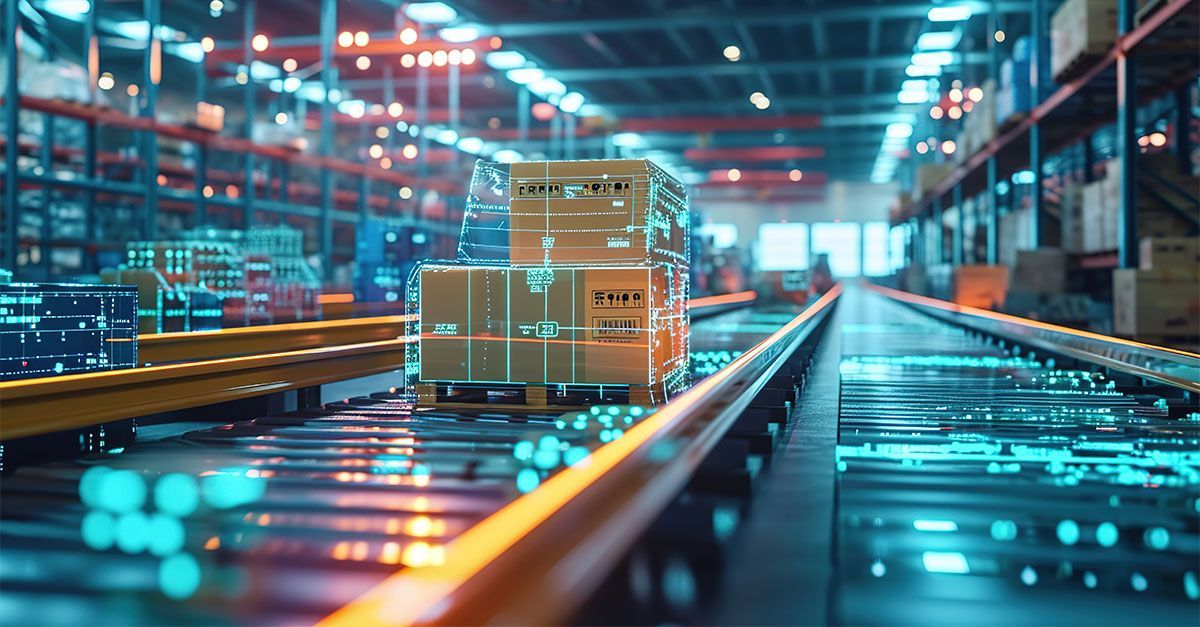
Reefer Freight Rates: Historical Average, How to Benchmark, Most Expensive Lanes, How Are They Calculated
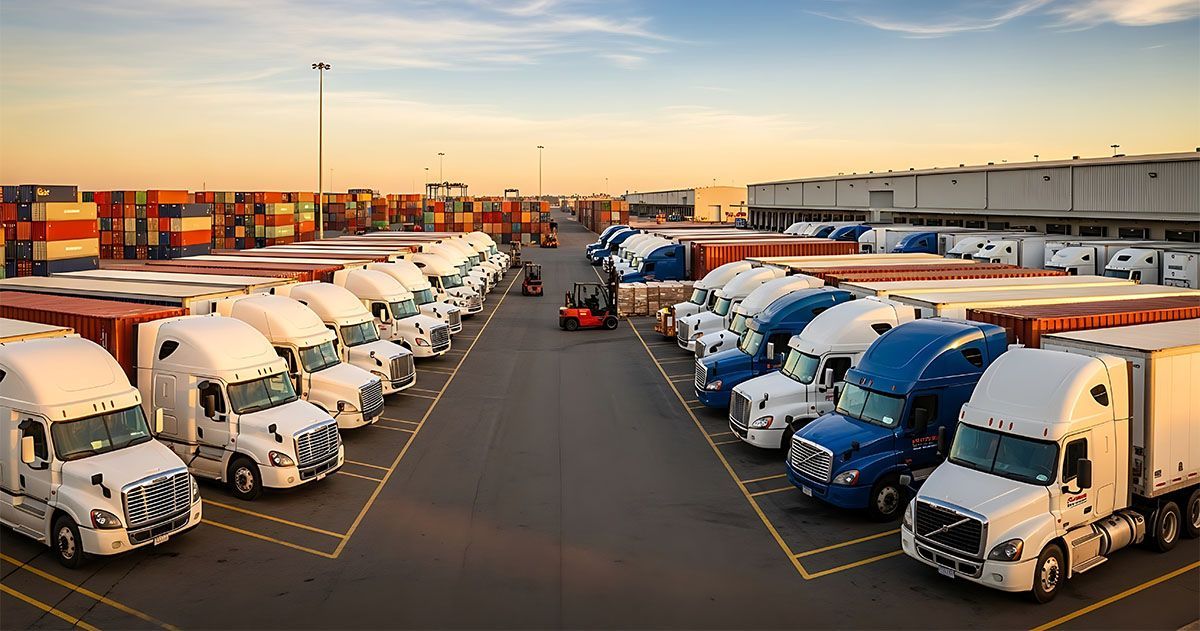
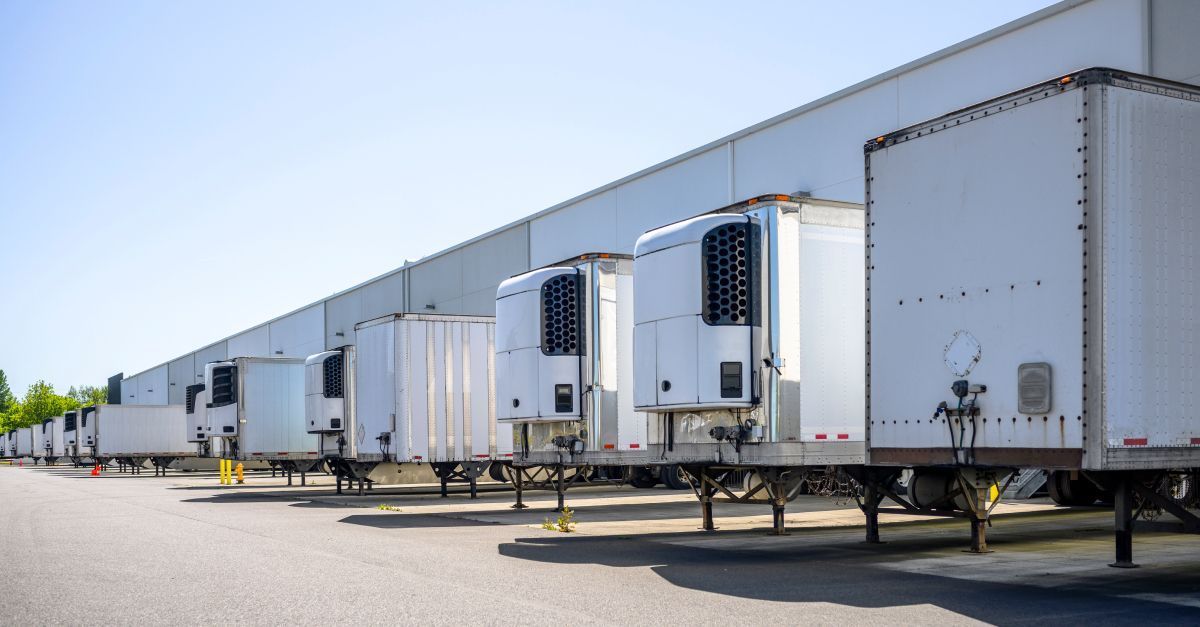
To transport perishables or other temperature-controlled freight, you need to use a refrigerated truck, also known as a reefer. Because the equipment for moving reefer freight, which can be transported in full truckload and less-than-truckload vehicles, is more costly to run and maintain, the rates to transport reefer freight are often higher than transporting dry goods. There are also fewer reefer trucks on the road than dry vans during a time when there is greater demand for truckload freight. While many factors determine the reefer freight rate, it is usually based on a cost-per-mile basis. For example, if the trip is going to be 400 miles and the cost per mile is $2.75, the freight charge would be $1,100. The per-mile rates differ for specific areas in the U.S., with rates usually being higher in the Midwest.
Reefer freight rates can affect the price and availability of perishable goods. If the reefer freight rate is high, the cost of the perishable at your local grocery might be higher. It can also result in fewer choices on market shelves because some companies that handle perishable products can be priced out of the market.
This blog explains reefer freight rates (both historically and in the present), reviews how to benchmark current rates, examines what makes some lanes expensive, and discusses the factors that help determine these rates. Ultimately, shippers will understand the complete process and what they need to know to negotiate more effectively with carriers.
Historical Average of Reefer Freight Rates
One thing you can say about reefer freight rates is that they have never been static. Because of so many determining factors, they are always fluctuations. But as of late, they have generally been inching up ever higher. In the three years prior to the COVID-19 pandemic, the reefer freight rate ranged from $1.80 to $2.61 per mile. After a dip down during the first couple of months of the pandemic, the rates have typically been rising over the past two and a half years.
Because many goods that come in reefer trucks or trailers are necessities, companies will still pay to have them shipped regardless of cost. During the first year of the pandemic, people were concerned about the availability of many items and began to stock up in case of emergency. That occasionally left some store shelves empty — and the demand for reefer transport to restock those shelves heightened. While reefer rates have leveled off somewhat, they are still rising in areas where there are still supply chain concerns and capacity is tight.
While we have been going through some extraordinary times over the past three years, the perspective of not only recent times but also looking back further is crucial to have any insight into predicting future rates. Shippers need to accurately forecast demand and rates to sustain cash flow and determine viable shipping costs. Carriers must also be able to predict rates and demand to make intelligent decisions about buying or leasing equipment.
Behind the success of
e-commerce, the market is still moving ahead. This means accurately estimating what rates will be like in the days ahead is even more vital. To do that, you need data and the kind of
technology that assimilates that data and puts it into perspective. For freight managers to better predict reefer rates, the use of artificial intelligence-guided systems and machine learning processes are crucial in computing past ratios of reefer-to-dry van rates for significant lanes to help look into what the future might hold in store. The volatility of the market will always impact reefer freight rates, but being fully invested accurately predicting them will provide you with an excellent chance to stay ahead of them and keep your costs in line.
Benchmarking reefer freight rates
When trying to benchmark reefer freight rates, there are several things to consider because there can be wide variations in terms. If you want to be in a position to confidently secure the best contract, comparing current rates to the historical average and other market indicators is the first step. Once you have that knowledge in hand, you can then go about navigating the negotiations. You’ll need to shop around. Even though there are fewer reefer options than dry vans, there are still many reefer freight rate offers available. Make sure you also have all the information on your shipment — weight, dimension, distance, lane it will travel, and the deadline for arrival — because that information will help determine what cost the companies can offer you. It might be beneficial and save you some money if you are flexible in your pickup dates, but only if that doesn’t risk the product getting spoiled or damaged.
Most importantly, you must ensure ensure you get a deal that satisfies you. If that is not the case, then further negotiation or a search of the competition for a new candidate would be in order. If the deal is to your satisfaction, you will want to have your product ready at pickup time and correctly
packaged and prepared for shipping. Idle time usually results in increased costs, so anything you can do to avoid waiting is greatly beneficial.
What Makes Some Reefer Loads More Expensive?
There are quite a few factors that can contribute to higher costs in reefer freight rates. Let’s take a look at five of them:
Length of journey
How far a shipment needs to be transported is always a major determining factor, but that is even more of a concern in reefer rates. With reefer loads, the product is not only temperature-sensitive but is customarily time-sensitive as well. A greater distance means it will take more time. And when the product has a time window for freshness, the window for that product to get on the shelves is reduced the farther it needs to travel. That means the carrier will usually charge more for the security and speed that it will arrive in time.
Weight
The issue with weight in reefer freight rates is twofold. The more weight there is in the shipment, the more it will cost. But there is also the question of density, which can often add cost to a shipment because of how much space the product takes up in the trailers. Weight and density do not always correlate. For example, a product like Romaine lettuce can weigh less than an avocado but can take up twice the space. If you are shipping Romaine lettuce, that can mean less room for the other products in your shipment. If your products need more space because of density concerns, it will cost more.
Fuel prices
The fuel price is easily one of the most significant cost factors in all shipping. The weight of a shipment impacts fuel costs because more weight means more strain on the truck to pull the load and more fuel being used to draw that truck forward. Fuel prices are also one of the most talked about subjects in shipping because the per-gallon prices have hit new heights in recent years. With fuel prices varying from state to state and region to region, the lane your shipment travels will determine the fuel cost.
Regulations
Produce and other perishable goods are often subject to state, local, and regional regulations that do not impact other products shipped across state lines. Some produce and perishable items may only cross the state lines with 0an inspection certificate. There are other regulations as well. For example, the Food Safety Modernization Act requires monitoring and maintaining temperatures for certain freight. Many reefer units have telematics that let carriers and shippers monitor and control temperatures. With the added equipment comes added cost. Also, regulations on emissions and other pollutants are often changing, and the cost of equipment to maintain those regulations also affects the bottom line.
Produce Season
Without a doubt, one of the major influences on reefer freight rates is the produce season. When fresh produce is ready for picking, it’s ready for shipping — which means it’s time for higher costs. In areas known for agriculture (the Midwest, California’s Central Valley, etc.), fresh produce is gathered in volume, and the demand for reefer shipping goes up, as do the rates in the shipping lanes from those places.
Factors That Determine Reefer Freight Rates
As we have mentioned before, there are quite a few factors that determine freight rates. Let’s go over a quick run-down of what can alter the reefer rates:
- Type and volume: Everything from the dimensions to the weight to the density is all figured in when determining reefer freight rates. Also, something like how much refrigeration at a specific temperature a particular product needs can impact costs.
- Distance and mode: As mentioned above, distance is one of the top factors in figuring out a reefer rate, but the transportation mode used to move the product can also affect the rate. There are reefer trucks with trailers attached and the more maneuverable refrigerated vans and insulated vans.
- Additional services or handling: Make sure the partner you are negotiating with identifies any special add-on services before you complete the deal. In some cases, the refrigeration unit must always remain on because the product can spoil if it gets warm and is then cooled again.
EFS Can Help You Tackle Reefer Freight Rates
When it comes to reefer freight rates, it’s important to know the past and the present. Looking at how the rates have changed historically can help possibly predict the future of those rates. This blog has also looked at how to benchmark current rates, laid out factors that help determine these rates, and presented things you need to be aware of when negotiating these rates. It can be hard to fathom all of the ins and outs of reefer freight rates but don’t worry because Entourage Freight Solutions (EFS) can help you steer through those depths. EFS is an expert in navigating refrigerated freight with a superior team designed to help shippers get freight on the road faster, at a competitive rate, and then trace that movement from its inception through delivery. Check out our numerous ways to ship and request a quote today at our website.